Simplifying Asset Insights with Automation and Data Integration


Visualizing asset data is key to uncovering insights quickly. However, manually processing and analyzing data is time-consuming and inefficient. Automation bridges this gap by transforming raw data into dynamic dashboards and visual reports, enabling faster, more informed decision-making.
Why Visualizing Asset Data Matters
- Instant Insights: Charts and graphs reveal patterns that raw numbers cannot.
- Faster Decision-Making: Quickly identify trends, inefficiencies, and risks.
The Power of Automation in Data Visualization
- Eliminates Manual Work: No more tedious spreadsheet updates.
- Handles Large Asset Volumes: Process thousands of data points instantly.
- Real-Time Monitoring: Stay ahead with up-to-the-minute insights.
Example: Automating Asset Analytics with n8n, Python and Grafana
Let’s walk through an automated workflow for collecting, analyzing, and visualizing asset data using n8n, Python, and Grafana.
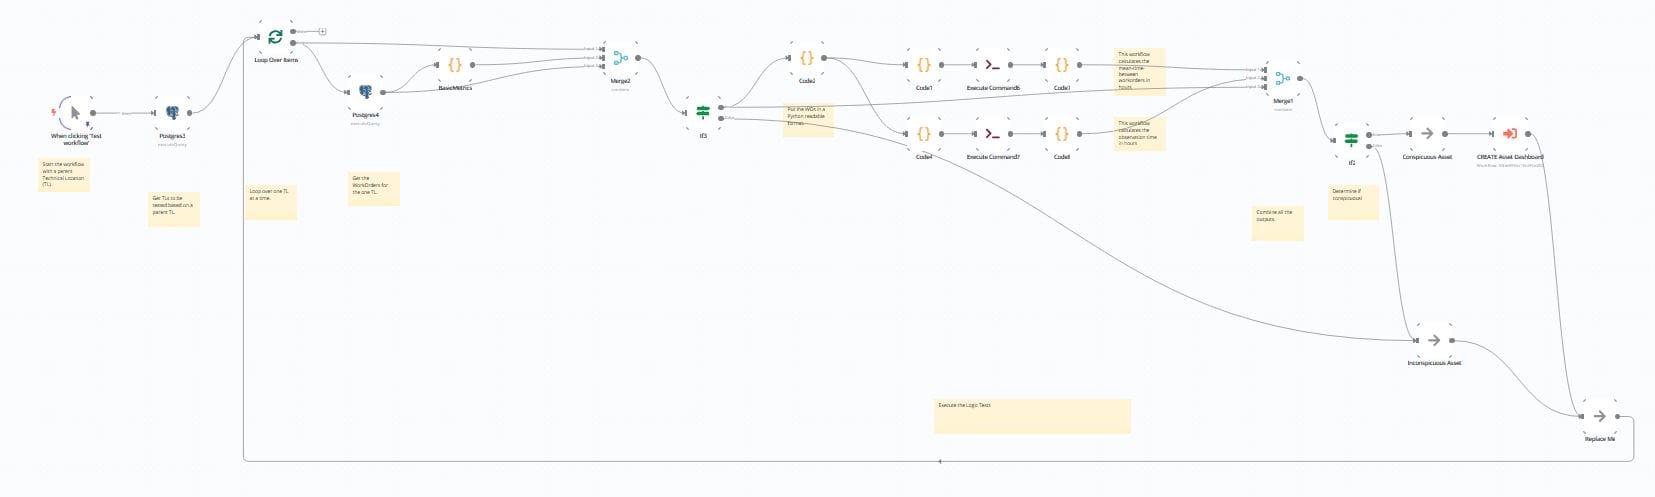
Workflow Automation with n8n
- Use n8n, a powerful workflow automation tool, to pull asset data from APIs, databases, or IoT sensors.
- Schedule workflows to fetch data at regular intervals.
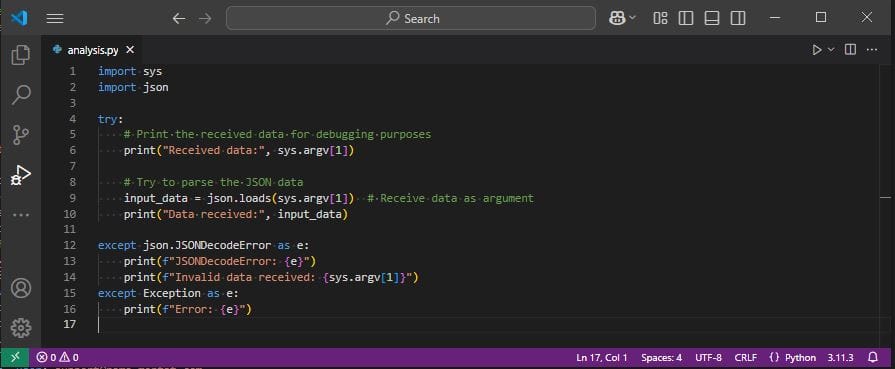
Data Processing with Python
- Pass the raw data to a Python script for cleaning, transformation, and analysis.
- Apply statistical methods or machine learning models to detect trends and anomalies.
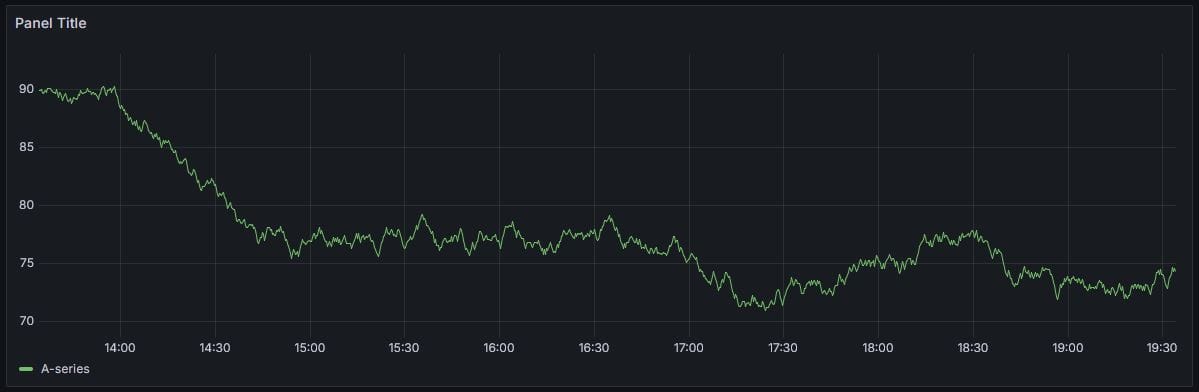
Visualization with Grafana
- Store processed data in a database (e.g., PostgreSQL, InfluxDB).
- Use Grafana to create real-time dashboards, displaying trends, performance metrics, and alerts.
Why This Approach Works
- n8n automates data extraction, reducing manual intervention.
- Python processes complex calculations, ensuring accurate analytics.
- Grafana provides real-time visualization, making insights instantly actionable.
By integrating these tools, organizations can eliminate manual data handling, accelerate decision-making, and gain deeper insights into asset performance. Start automating today and turn your asset data into powerful, real-time dashboards!
💡
Curious about a specific step? Drop a comment, and I’ll expand on it in future updates!